
Overview
The Weekly Open Reversion Model is based on the observation that price frequently returns to the Weekly Open under specific intraday liquidity conditions.
This model integrates ICT-style session behavior with statistical validation across multiple market regimes.The research focuses on identifying when the Weekly Open acts as a high-probability liquidity target, rather than assuming it is always relevant.
Key Finding : Under defined liquidity conditions, price returns to the Weekly Open with a historical probability of approximately 75–90%.
Core Hypothesis
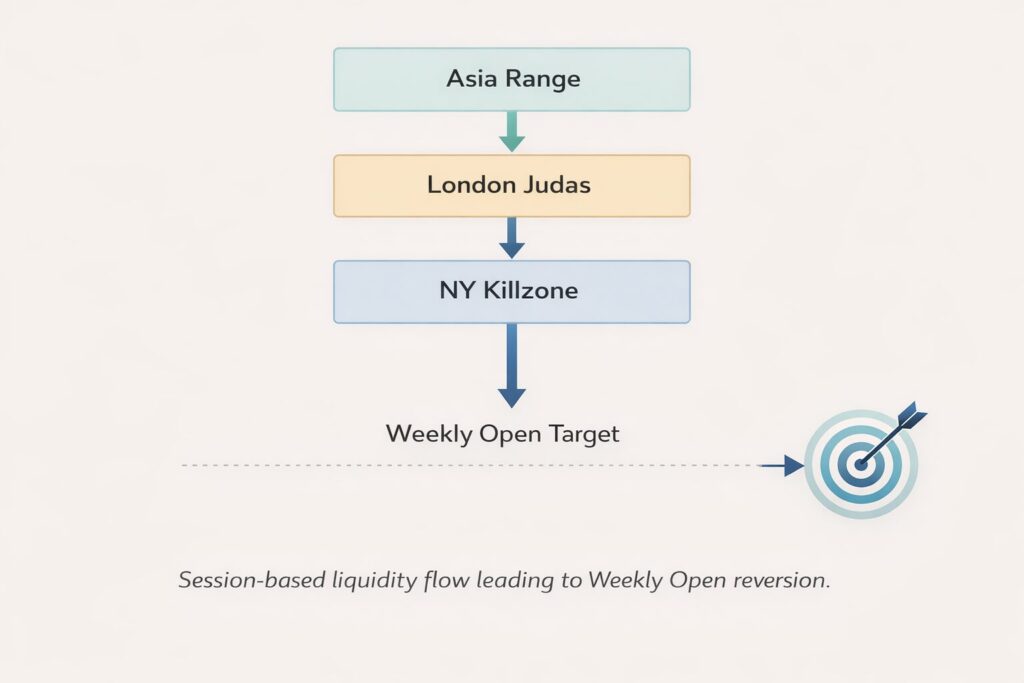
When the following conditions are met, price tends to revert to the Weekly Open:
- London Judas displacement occurs
- Asia Range is within a defined volatility band
- Directional liquidity sweep confirms bias
- New York Kill Zone provides continuation window
Under these conditions, the Weekly Open behaves as a mean reversion magnet.
Research Dataset
- Instrument: EURUSD
- Data Source: HistData (M1)
- Period: 2019 – 2026 (March)
- Session Timezone: New York (EST/EDT)
- Entry Window: NY Kill Zone (08:00–09:05 NY)
Core Conditions
The model evaluates Weekly Open reach probability when:
- Asia Range between 20–50 pips
- Judas Direction confirmed
- Skip / low-liquidity days excluded
- Entry restricted to NY Kill Zone
Statistical Results (2019–2026)
| Year | Long Reach | Short Reach |
|---|---|---|
| 2019 | 94% | 98% |
| 2020 | 76% | 85% |
| 2021 | 93% | 89% |
| 2022 | 66% | 65% |
| 2023 | 85% | 78% |
| 2024 | 94% | 82% |
| 2025 | 88% | 82% |
| 2026* | 77% | 94% |
*Partial year
Weekly Open Reach Probability (2019–2026)
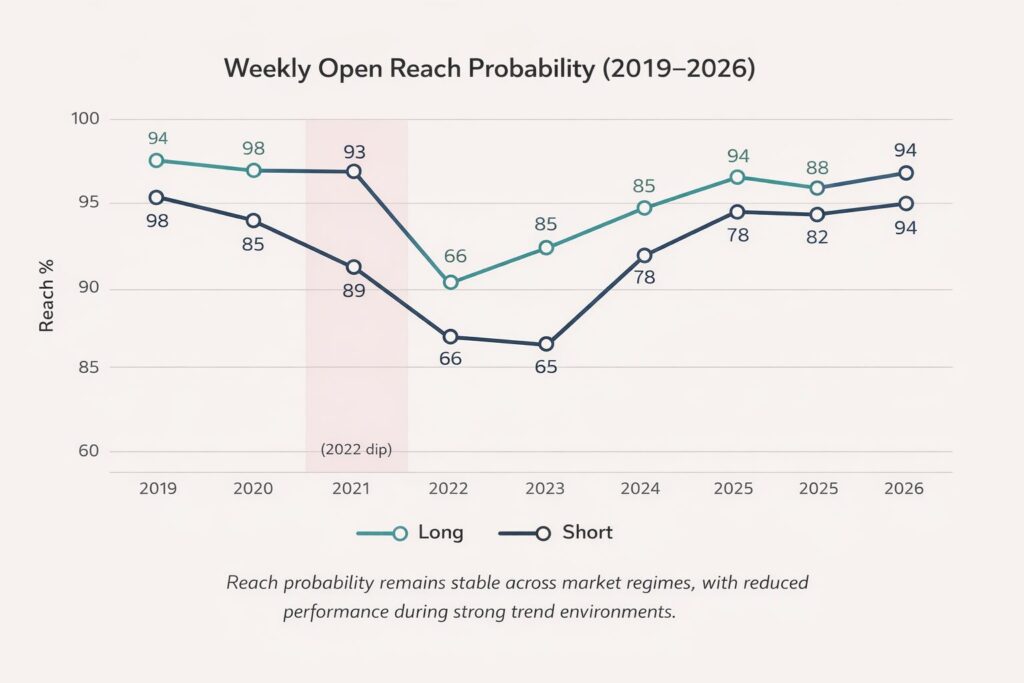
Reach probability remains stable across market regimes, with reduced performance during strong trend environments.
| Market Condition | Reach Probability |
|---|
| Range Environment | 90%+ |
| Normal Market | 75–85% |
| Strong Trend | ~65% |
| Overall Average | ~81% |
Research Dataset
The dataset below summarizes Weekly Open reach probability from 2019–2026 under session-based liquidity conditions.
Download Research Data (Excel)
Average Reach Probability: 81%
Minimum Observed Reliability: 65%
Best Observed Performance: 94%
Interpretation
- Strong performance in ranging environments (90%+)
- Reduced accuracy during strong trend years (≈65%)
- Stable mean performance: 75–85%
- Minimum observed reliability: ≈65%
This confirms the Weekly Open is conditionally predictive, not universally valid.
Model Logic
Bias Determination:
- Asia High below Weekly Open → Long bias
- Asia Low above Weekly Open → Short bias
Execution:
- Confirm Judas displacement
- Enter in NY Kill Zone
- Target Weekly Open
Strengths
- Statistically validated across regimes
- Works in both trending and ranging markets
- Simple and transparent logic
- Compatible with ICT session models
Limitations
- Reduced reliability during extreme trend periods
- Requires volatility filter (Asia Range)
- Not designed for low-liquidity sessions
Practical Use
The Weekly Open should be treated as:
- A conditional liquidity target
- Not a standalone trading signal
- Most effective when combined with session-based displacement
Practical Use
The Weekly Open should be treated as:
- A conditional liquidity target
- Not a standalone trading signal
- Most effective when combined with session-based displacement
Conclusion
The Weekly Open Reversion Model demonstrates that the Weekly Open acts as a statistically reliable target only under defined liquidity conditions.
This supports the idea that market structure is governed by liquidity engineering rather than fixed directional bias.
Short Version (Card Text)
Use this for preview box : Weekly Open Reversion Model
Statistical research (2019–2026) showing 75–90% probability of price returning to Weekly Open under defined ICT session conditions.
The Weekly Open should not be treated as a directional signal, but as a conditional liquidity target.
This research confirms that the Weekly Open functions as a conditional liquidity target rather than a fixed directional bias.