
Overview
This research empirically tests the ICT concept of Low Resistance Liquidity Run (LRLR) and High Resistance Liquidity Run (HRLR) — the idea that a price move toward a liquidity target is either “clean” (few prior swing points in its path) or “resisted” (many prior swing points in its path). The objective is to quantify path structural density on an objective, rule-based basis and measure how it relates to subsequent price behavior, rather than to provide a standalone trading signal.
Key Finding: Across 6 instruments, 3 timeframes (Daily, H1, Weekly), and two distinct market regimes (2015–2019 and 2019–2026), legs classified as HRLR (dense prior structure in their path) consistently showed lower maximum retracement and higher clean-run rates than legs classified as LRLR — the opposite of the commonly assumed relationship. This pattern held in every timeframe/instrument/period cut tested (72 combinations), with pooled statistical significance of p < 0.0001 in all three timeframes.
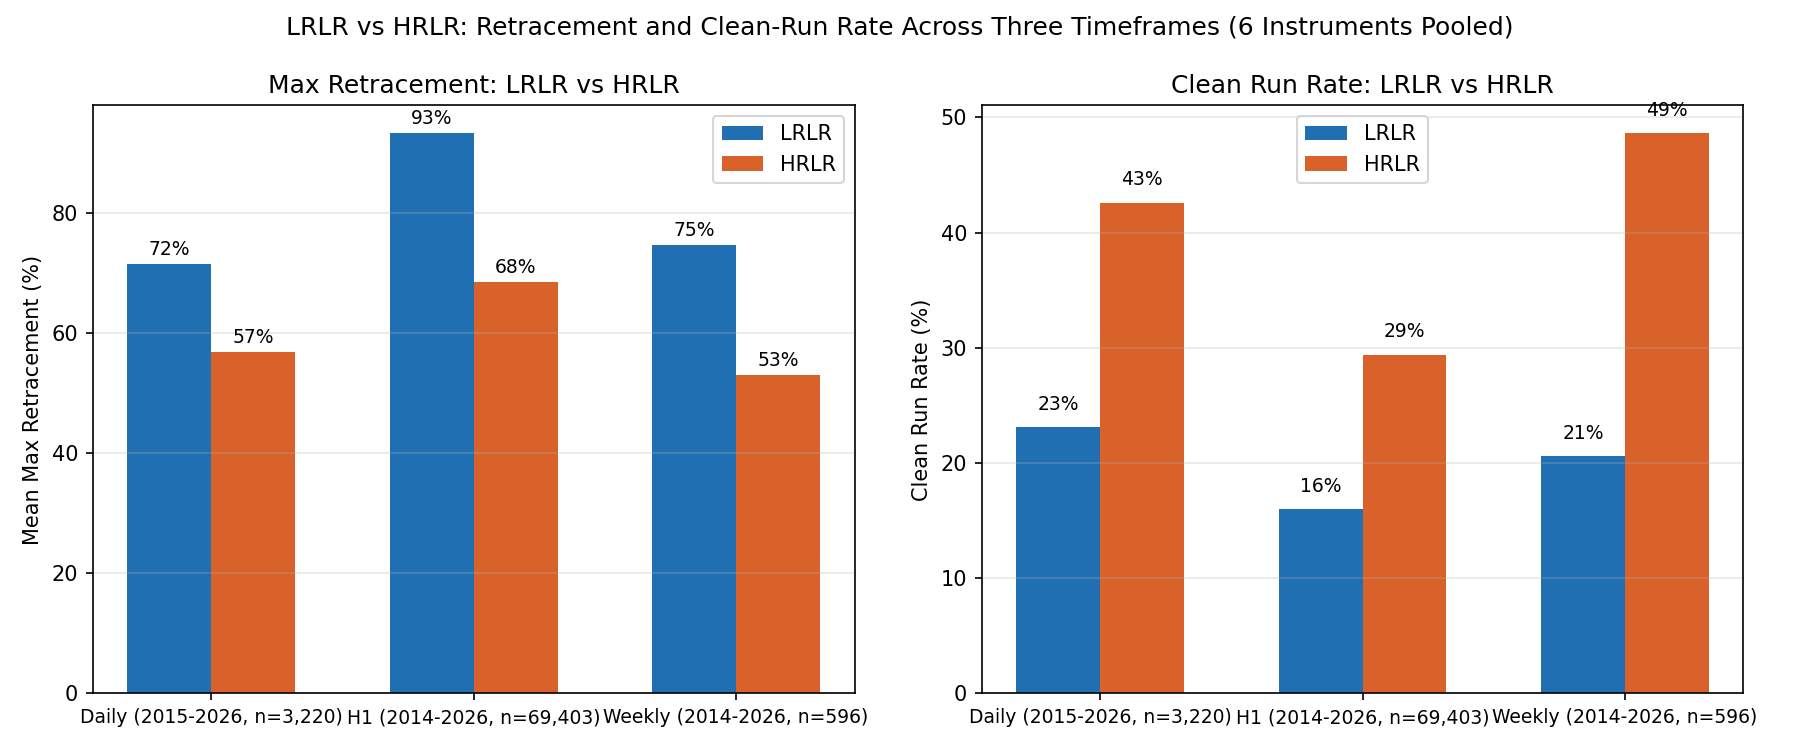
Mean maximum retracement and clean-run rate by classification, pooled across 6 instruments, for each of the three timeframes tested.
Core Hypothesis (ICT Primary Source)
Per the original 2016 ICT Mentorship Core Content definition, a liquidity run is classified by how much prior market structure lies between the current price and the liquidity target — not by any single indicator (the popular association with Fair Value Gaps is not part of the original definition):
- LRLR (Low Resistance Liquidity Run): few or no prior swing highs/lows lie in the path to the target — an “open” run.
- HRLR (High Resistance Liquidity Run): the path is congested with prior swing highs/lows (peaks and troughs) — price has to work through prior structure to reach the target.
ICT states this framework is timeframe-agnostic (“time is irrelevant… this is not specific to any timeframe, it’s universal”), which motivated testing it across Daily, H1, and Weekly data independently.
Research Dataset
- Instruments: EURUSD, GBPUSD, USDJPY, AUDUSD, XAUUSD, BTCUSD
- Data Source: MT5 broker export (OHLC)
- Daily: 2015 – 2026 (split into a 2015–2019 and a 2019–2026 sub-period to test for regime change), n = 3,220 legs
- H1 (1-hour): 2014 – 2026, n = 69,403 legs
- Weekly: 2014 – 2026, n = 596 legs
Detection Logic
- Swing detection: a 3-bar fractal — a bar’s high (low) is a confirmed swing high (low) if it is strictly greater (less) than the 3 bars on each side.
- Leg: the price segment between two adjacent confirmed swing points (the atomic unit of analysis — a multi-week directional move is typically composed of many legs, not one).
- n_structure: for a given leg, the count of previously-confirmed swing points (any point earlier in the dataset, not just recent ones) whose price falls strictly inside that leg’s own price range.
- Classification: within each instrument/dataset, legs with n_structure at or above the median are labeled HRLR; legs below the median are labeled LRLR.
- Max Retracement (%): the largest give-back against the leg’s direction at any point during the leg (tracked via running peak/trough), expressed as a percentage of the leg’s total magnitude. 0% = a straight, uninterrupted move; 100% = the entire accumulated move was given back at some point before completion.
- Clean Run Rate: the percentage of legs in a group with Max Retracement below 50%.
Visual Definitions
Two of the terms above are easiest to understand visually: what a “leg” and n_structure actually look like on a chart, and how Max Retracement % is measured within a single leg.
Statistical Results
Pooled results by timeframe (6 instruments)
| Timeframe | n (legs) | LRLR Retracement | HRLR Retracement | LRLR Clean Rate | HRLR Clean Rate | p-value |
|---|---|---|---|---|---|---|
| Daily (2015-2026) | 3,220 | 71.5% | 56.9% | 23.1% | 42.6% | < 0.0001 |
| H1 (2014-2026) | 69,403 | 93.3% | 68.5% | 16.0% | 29.4% | < 0.0001 |
| Weekly (2014-2026) | 596 | 74.8% | 53.1% | 20.6% | 48.6% | < 0.0001 |
p-values are from Mann-Whitney U tests on Max Retracement (results for the Clean Run Rate chi-square test were consistent in every case).
Daily results by instrument (2015-2026, pre/post-2019 pooled)
| Instrument | n | LRLR Retracement | HRLR Retracement | LRLR Clean Rate | HRLR Clean Rate |
|---|---|---|---|---|---|
| EURUSD | 516 | 65.4% | 55.7% | 24.8% | 43.4% |
| USDJPY | 500 | 68.1% | 54.7% | 22.9% | 46.7% |
| GBPUSD | 506 | 65.7% | 55.3% | 28.6% | 44.6% |
| AUDUSD | 523 | 72.2% | 54.5% | 23.0% | 45.9% |
| XAUUSD | 478 | 70.4% | 55.2% | 25.2% | 47.3% |
| BTCUSD | 697 | 83.2% | 63.4% | 16.2% | 32.2% |
Dose-response (continuous n_structure vs. path smoothness)
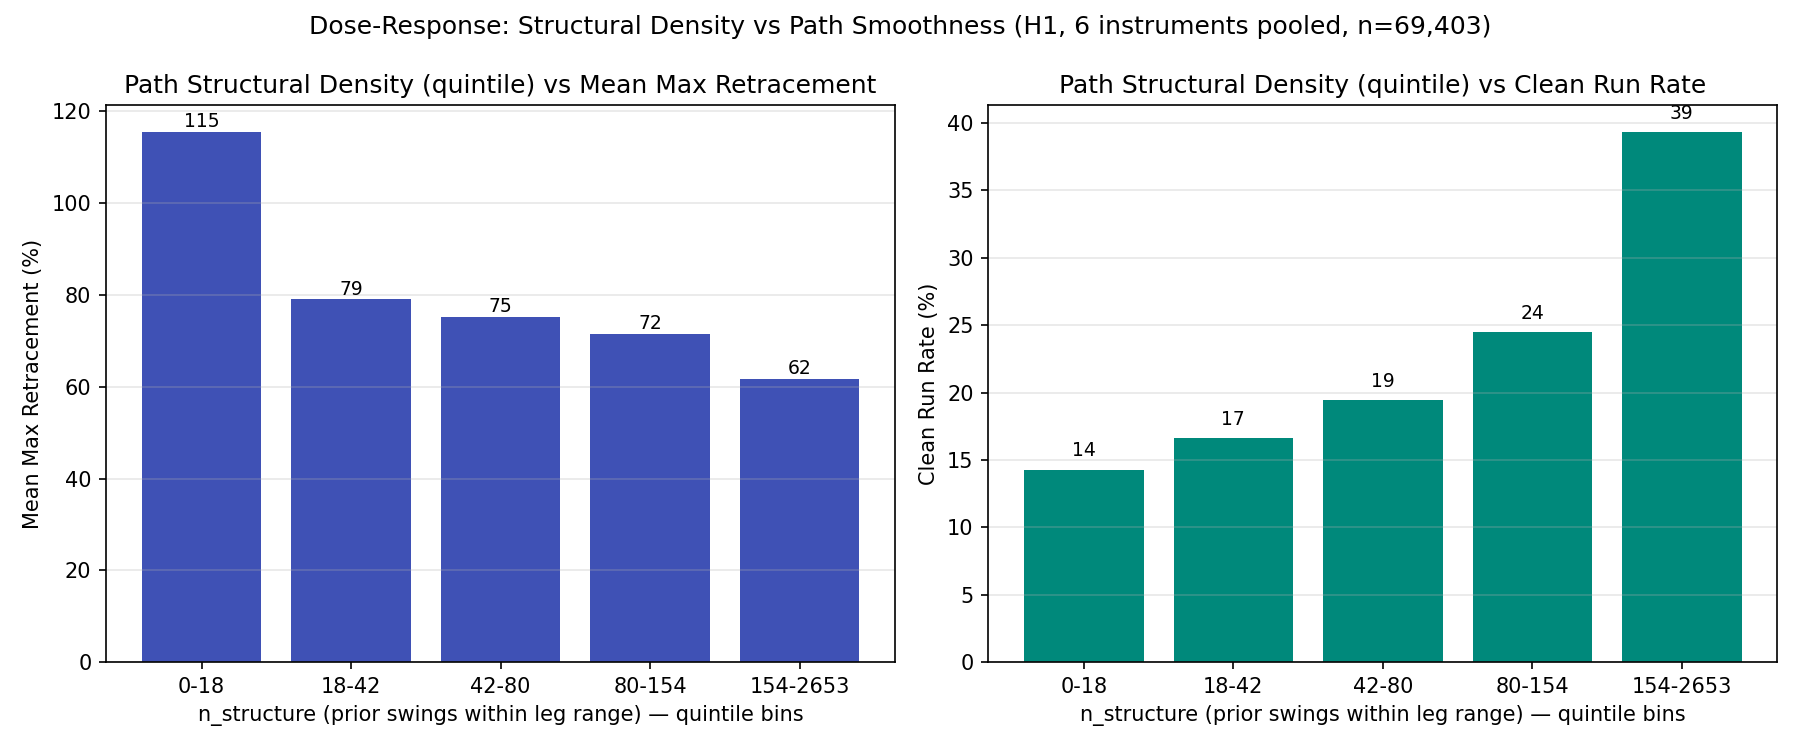
H1 data, 6 instruments pooled (n = 69,403), legs grouped into 5 bins by n_structure. The relationship is monotonic in both metrics, not just an artifact of the median split.
Spearman correlation between n_structure and Max Retracement: Daily r = -0.34, H1 r = -0.21, Weekly r = -0.45 (all p < 0.0001). All three timeframes agree in direction.
Regime Dependency
Because HRLR/LRLR labels are assigned by a median split, roughly half of all legs in the full dataset are HRLR by construction. In any given recent window, however, the proportion can deviate sharply from 50/50. Checking the most recent ~1-2 years of legs per instrument (H1 and Weekly, separately) shows that instruments in a ranging/choppy phase generate a strong majority of HRLR legs (GBPUSD, AUDUSD, BTCUSD: 83-100% HRLR), while an instrument in a sustained directional trend generates mostly LRLR legs (XAUUSD: 0-29% HRLR over the same recent window, essentially all-LRLR during its 2024-2026 rally). The mechanism: legs formed during range-bound conditions are small and sit close to recently-formed neighboring swings, which inflates n_structure; legs formed while breaking into new price territory are large and pass through price levels with little prior structure, which deflates n_structure. This is consistent with the definition mechanics and with ICT’s own qualitative description — the reversal described below concerns what happens after a leg is classified, not the classification logic itself.
Interpretation
The classification logic itself behaves as expected: legs formed during congestion/consolidation are correctly flagged as HRLR, and legs formed during clean directional expansion are correctly flagged as LRLR. What is counter-intuitive is the subsequent price behavior within each group: LRLR legs — the “open” runs with little prior structure in the way — actually retrace further and reach their target less cleanly than HRLR legs do. One plausible explanation is a confound with leg magnitude: LRLR legs tend to be the larger, more extended moves in a dataset (by definition they push into price territory with fewer prior visits), and larger moves have more room, in absolute terms, to give back a meaningful percentage before completing. This does not fully resolve the puzzle, but it is offered as a candidate mechanism for further study.
Strengths
- The core finding replicates independently across 3 timeframes, 6 instruments, and 2 distinct market regimes (72 independent cuts of the data).
- The operational definition follows the primary 2016 ICT source directly (structural density of prior swing points), rather than a secondary or popularized proxy such as Fair Value Gaps.
- The dose-response relationship (continuous n_structure vs. outcome) is monotonic, indicating the pattern is not an artifact of the median-split threshold.
Limitations
- This is exploratory research by a single researcher, not peer-reviewed academic work. The specific operational choices (3-bar fractal width, median-split threshold, 50% clean-run cutoff) are reasonable interpretations of a qualitative concept, not values specified by the original source — different reasonable choices could shift the exact figures.
- The methodology was refined iteratively over the course of this research (an earlier Fair-Value-Gap-based proxy was replaced with the structural-density definition after re-reading the primary source), which carries some risk of hindsight-driven definition selection even though the final definition is the one used throughout every result reported here.
- No out-of-sample holdout or pre-registration was used; all periods shown were used for both exploration and reporting.
- Spread, slippage, and trade execution are not modeled. This is a study of price-structure statistics, not a backtest of a tradable strategy.
- Classification frequency (see “Regime Dependency” above) is sensitive to the current market regime per instrument, which should be accounted for when applying this research qualitatively to a live chart.
Practical Use
This research should be treated as:
- Evidence that “resistance” in the classic ICT sense (structural density) does not straightforwardly predict subsequent path smoothness — the two questions (how a leg is classified, and how it behaves afterward) should be kept separate.
- Not a standalone trading signal, and not a reason to fade every clean-looking breakout or chase every choppy range.
- A starting point for further study into what actually drives retracement and clean-arrival rate — magnitude, duration, and regime all appear relevant and are not yet fully disentangled from structural density.
Conclusion
Across every independent cut of the data tested — three timeframes, six instruments, two market regimes — legs with denser prior structure in their path (HRLR) showed smoother subsequent price action than legs with an ostensibly clear path (LRLR). This is the opposite of the naive reading of the LRLR/HRLR framework, though the classification mechanics themselves behave exactly as the primary source describes. The finding is robust to how it has been sliced so far, but remains an open empirical question rather than a settled explanation.
Short Version (Card Text)
Liquidity Run Resistance (LRLR/HRLR)
Statistical research (2014-2026, 6 instruments, 3 timeframes) testing ICT’s Low/High Resistance Liquidity Run concept via path structural density.
Counter-intuitively, HRLR legs (dense prior structure) show lower retracement and higher clean-arrival rates than LRLR legs, across every timeframe and instrument tested.
This research should be read as an open empirical question about path structure and subsequent price behavior, not as a standalone trading signal.